How to Read Competitor Price Data: A Field Guide for E-commerce Merchants

Most stores collect competitor pricing data and never get past staring at it. Here is how to actually read the numbers, the patterns to look for, and what each one tells you about how the market behaves around you.

Reading numbers, not just collecting them

Competitor pricing data is easy to collect. Reading it is harder. A dashboard full of numbers tells you very little until you know what shapes to look for. The merchants who get the most out of competitor price tracking are not the ones with the most data. They are the ones who recognise the patterns first.

This guide walks through five patterns that show up consistently across e-commerce categories. Each one reveals something specific about how a competitor operates, what they will probably do next, and where your own pricing has room to move. None of them require a degree in statistics. They just require knowing what to look at.

The charts below use representative data, not real customer numbers. The shapes are what matter. Once you have seen them here, you will start spotting them in your own data within a week of running competitor price tracking on your store.

Pattern 1 - Pricing rhythm

How often competitors act and the rhythm of their actions

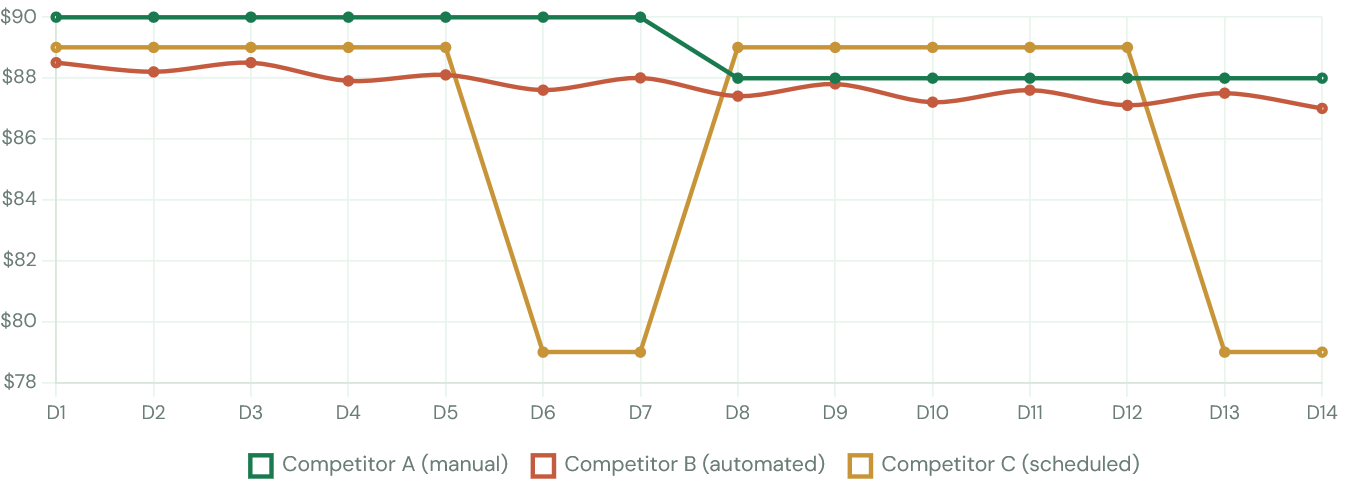
Three competitors, same product, fourteen days. The lines look completely different and that difference is the entire point.

Competitor A is steady and almost flat. Two small adjustments in two weeks. This is a manually managed price, probably set by a category manager who reviews weekly. They are predictable, which is useful.

Competitor B moves every day, often twice. The amplitude is small but the frequency is constant. This is automated repricing software running against a defined target, almost certainly the lowest competitor in the market. They will follow you down if you drop. They will also follow you up.

Competitor C is flat for five days, then drops sharply on the weekend, then reverts. This is a scheduled promotion, not a permanent reprice. If you match their weekend price you are matching a temporary state and your Monday morning will be uncomfortable.

What it tells youThe shape of a competitor's price line over two weeks reveals their pricing system. Manual pricers are predictable but slow. Automated pricers are reactive and fast. Scheduled pricers are loud but temporary. You respond to each one differently.

Pattern 2 - Stock-price correlation

When inventory drops, watch what the price does next

Same product over three weeks. The blue line is the competitor's price. The orange line is their stock level. Watch what happens around day twelve.

Stock is dropping steadily as the product sells through. At day twelve, when stock crosses below roughly twenty units, the price ticks up four percent. Then again at day sixteen as stock approaches single digits. By day eighteen the product is unavailable.

This is rationing behaviour. The competitor is using price to slow demand on a low-inventory item, protecting the remaining stock for higher-margin sales rather than blowing it out. The reverse pattern (rising stock, falling price) shows up too, usually after a wholesale delivery or when a category is being cleared.

What it tells youA competitor whose price rises with falling stock is a sophisticated pricer. They are giving you a window: if their price has risen because they are running out, you can hold or raise your own price without losing share. If you do not track competitor stock, you miss this signal entirely.

Pattern 3 - The undercutting war

Two automated repricers, one product, no margin protection

Two competitors, both running automated repricing rules that target "lowest competitor minus one cent." The result is the cleanest example of self-destructive pricing in e-commerce.

Day one, both sit comfortably above eighty dollars. By day three, each repricing engine sees the other below it and drops. By day five, both are pricing below cost (the dashed line). Neither human noticed. The rules just kept firing against each other every few hours until margin was gone.

This pattern is more common than people think, especially in categories where two or three retailers stock identical SKUs from the same supplier. If you see this shape developing in your data and your store is one of the lines, you have a margin emergency. If you see it and your store is not one of the lines, you have a category opportunity: hold your price, let the two competitors exhaust each other, and pick up the demand they cannot fulfil profitably.

What it tells youSpotting an undercutting war early gives you a choice. Joining it is almost always wrong. Sitting it out is almost always right. The losers will stop within ten to fourteen days when the margin damage becomes visible internally.

Pattern 4 - Spread compression

When the gap between cheapest and most expensive starts to close

The shaded band shows the price spread for a single product across all tracked sellers, week by week. In week one the spread is nineteen dollars between the cheapest and most expensive. By week six it is six dollars.

Spread compression means the market is converging on a price. This usually happens for one of three reasons: a new competitor entered with aggressive pricing and pulled everyone toward them, a manufacturer enforced minimum advertised pricing, or the category matured to the point where pricing power is gone.

For your store, compression is a strategic signal. The price lever is losing power in this category. Differentiation has to come from elsewhere: shipping speed, bundle offers, product expertise, post-purchase support. If you keep competing on price as the spread tightens, you are spending more energy for less reward every week.

What it tells youA widening spread is opportunity. A compressing spread is a category telling you to stop pricing and start positioning. Watch this metric monthly across your top categories.

Pattern 5 - Regional gaps

Same retailer, same product, different country, different price

One retailer, one product, three regional storefronts tracked over a month. The prices move together (same supplier, same costs upstream) but the absolute levels are nine to fourteen percent apart at any given moment.

This is normal. Regional pricing reflects local tax structures, local competition, and local demand. The mistake is matching against the wrong region. If you are a Dutch store comparing yourself to the same retailer's French listing, your repricing engine is chasing a price that targets a different market entirely.

Good competitor price tracking software extracts region and language information from competitor URLs automatically, which lets you filter your competitive set to only listings in your actual market. Without that filter, regional gaps quietly poison your pricing data.

What it tells youIf your "lowest competitor" is from a different region, it is not your competitor. Filtering by region is the difference between accurate competitive intelligence and a confused dashboard.

If you only do one thing, do this

Pick three SKUs. Not your whole catalogue, not your top fifty. Three. Choose products you care about, where pricing actually moves, and where you have at least two real competitors.

Watch them for two weeks. Open the pricing graph on each one every couple of days and ask the same question: which of the five patterns is showing up here? You will be wrong sometimes. That is fine. The point is to train the reflex.

By the end of the second week, the patterns stop being a checklist you have to remember and start being something you see automatically when a chart loads. That is the moment competitor price tracking earns its place in your week. Until you have that reflex, more data does not help. After it, more data compounds.

Stop trying to act on every price move. Start trying to recognize what kind of move it is. The decisions follow from that.

Find us on your platform

Shopify logo
Github logo
Composer logo
Woocommerce logo
Sello logo